

Use of Immersive Technologies for Business Intelligence
The summarized work below was carried out for an MSc in Management and IT dissertation.
Research Question
The research was geared at how, and how effectively, can immersive technologies be used for the purpose of Business Intelligence.
Immersive Technologies aim to attain a deep mental involvement of a person into an activity and/or an intense concentration or complete absorption into the activity that one undertakes, and are associated with the use of, but not limited to, relatively newer media such as AR (Augmented Reality), VR (Virtual Reality) and CAVEs (Cave Automatic Virtual Environments). These environments produce high-resolution visualizations that populate a large portion of user’s field of view, if not all of it, and through use of high-resolution imagery, ‘immerse’ the user in what is being projected.
They also aim to simplify the interaction with user and software/data by reducing the peripheral devices and moving towards a future where user can manipulate virtual objects without manual aids.
Business Intelligence is “an umbrella term that includes the applications, infrastructure and tools, and best practices that enable access to and analysis of information to improve and optimize decisions and performance”.
Types of Immersive Technologies
The most common 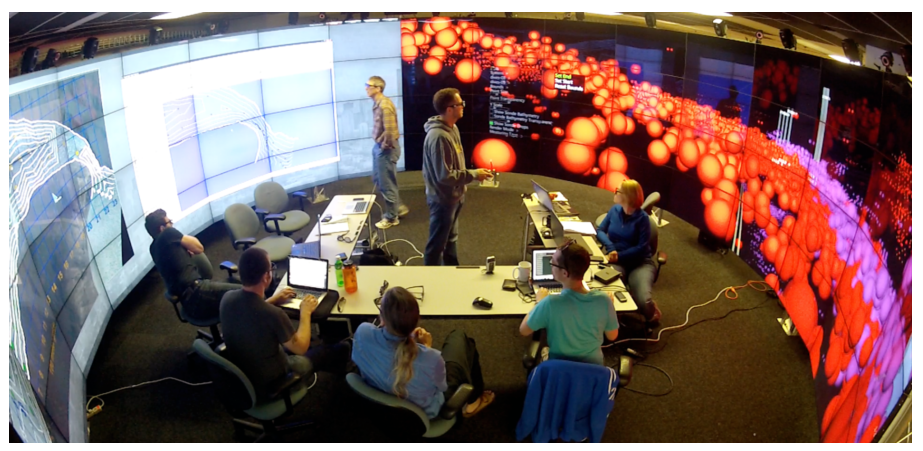 types of immersive technologies can be categorized as follows:
Interactive environments: The user is not perceived to be inside the interactive environment; he is cognizant of the fact that the interaction is a supplementation to his reality and the reality never leaves him.
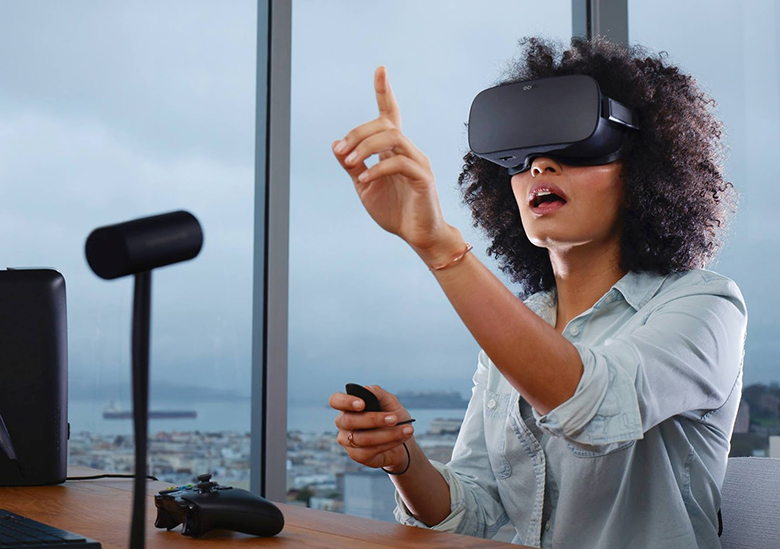
Virtual Reality (VR): a computer-generated environment totally detached from the user’s present time and space and requiring the user to step into the virtual environment. A VR may or may not mimic the properties of a real-world environment and may defy the commonly accepted laws of physics such as gravity and time.
Augmented  Reality (AR): the simulation is superimposed over the physical environment and made a part of it, hence the augmentation. It can also be viewed as a form of VR with a clear view of the real world.
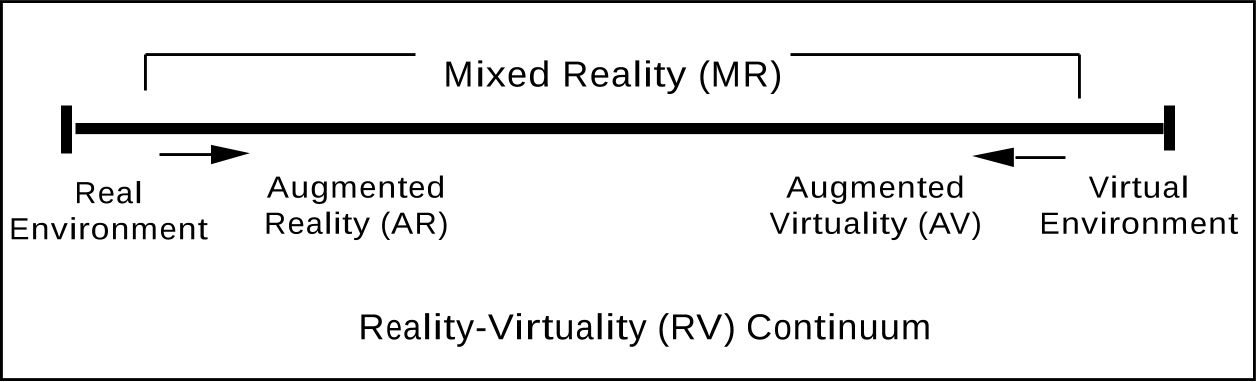
Paul Milgram conceptualized AR and VR through a Virtuality-Reality Continuum. A Mixed Reality environment can follow anywhere in between the two extremities of real environment and virtual environment.
Use of Immersive Technologies for Business Intelligence
Immersive Technologies hold a lot of potential for data analysis and insight. They overcome the barriers of limited space for viewing on traditional displays by providing environments we can create and mould according to our needs, and in which we can surround ourselves with data, left, right, and centre. They are a natural medium for 3D visualizations (not that 3D is always the best medium): user can walk through 3D lattices, view data from different perspectives and with greater degrees of freedom and interact with data using intuitive gestures. They also provide a means for collaboration where multiple users can simultaneously work on a problem in a CAVE or a 3D immersive room, with the possibility of remotely connecting to these environments.
Immersive technologies also provide means for simulations and predictive analyses. A plan or a risk situation can be simulated using input parameters and pre-defined algorithms, creating realistic To-Be scenarios.
Some concerns and gaps in current immersive tech are listed in table below:
| Gap | Explanation |
| Immersive Analytics at Enterprise-level under-researched | Major BI vendors have only recently begun paying attention to immersive technology., and that only a handful of them |
| Data still not one with the user | Hardware such as HMD(head-mounted display) becomes a barrier to natural interaction. The mechanisms to manipulate data in a natural way need further refinement. HMDs also raise concerns of health and safety (e.g. neck strain) |
| Remote unavailability of CAVEs | CAVEs are expensive pieces of equipment and have to be accessed at their physical locations. Remote connection to the environment through avatars can widen their user-base. |
| Accessibility issues | With a great emphasis on visuals, accessibility features are almost ignored in development of immersive systems |
| Context Switching | Partial immersion, i.e. some components immersive and some non-immersive can increase context switching when user has to move in and out of the environment to perform different tasks. |
| Navigation issues | Occlusion, shadowing, ineffective colour schemes can create navigation issues and may obscure points of interest in a 3D plane |
Commercial BI vendors are finally beginning to show interest in immersive technologies for data analysis. SAP is working on a VR-based Logistics product. Accenture has built three Connected Analytics Experience rooms with immersive capabilities. Microsoft is already a leader in Immersive hardware with HoloLens, there’s much potential in augmenting its PowerBI suite with immersive applications.
Guidelines for the use of immersive technologies in Business Intelligence
The following guidelines have been suggested in light of a literature and product review.
- Use of correct medium – 2D vs 3D: Just because immersive environments support 3D well, doesn’t mean all data needs to be in 3D. It depends on the type of data and use-case-specific requirements.
- Parameters for better environments: The right colour balance and brightness play a major role in usability of a system. An immersive system can be adjudged on the basis of user experience, usability , effect on collaboration, Insight generation, cognitive workload , task performance , feature set utility, algorithmic efficiency, and component interoperability.
- Effective means of interaction: Various ways of interaction, such as drag and drop, zooming, sliding, etc, should be supported. To fully utilize the 3D immersion, six degrees of freedom should be supported. The possibilities of walk-throughs, fly-overs, annotating, etc, can add to the completeness of the environment.
- Dealing with heterogeneous data: Since they can accommodate a lot of data in user’s field of view, it may be needed to homogenize that data in some way. This may be done through quantifying data into similar metrics or using data fusion techniques.
- Simulator sickness and safety: Immersive environments are prone to some health and safety issues such as eye-strain, disorientation, nausea, phobias such as claustrophobia and acrophobia, disregard of actual physical boundaries of a location hosting an immersive environment. Environments should be built with these concerns in mind.
- Help features: There should be adequate help options to help user navigate smoothly through an immersive system and exit safely without hiccups.
- Switching between immersive and non-immersive environment: Context switching can be reduced by providing connections to external systems from within the immersive systems.
- Security: Data being sent to an immersive environment must be safeguarded through physical access control, data encryption, and network security. Sign-out can be enforced once a user takes off his HMD or exits a CAVE.
Use-cases summaries
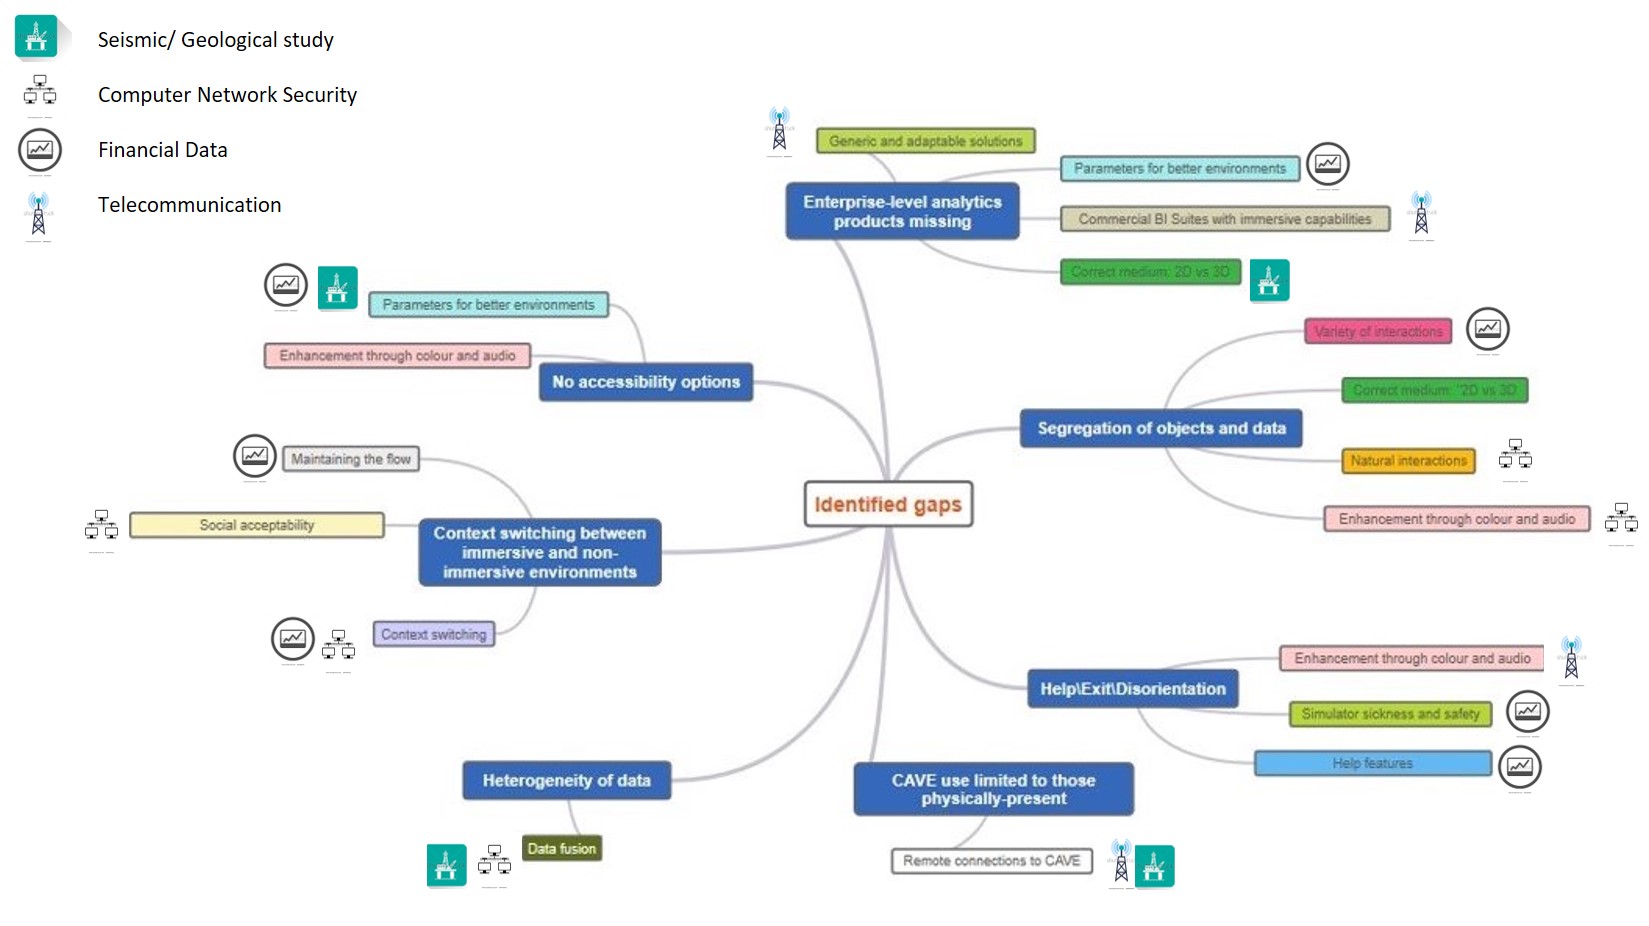
In light of the gap analysis and guidelines, four use-cases were created. A mapping for gaps, guidelines, and use-cases is shown in figure below, followed by summarized explanations of each use-case.
1. Computer Network Security
A computer network is mapped like a city in a virtual environment with routers, switches, PCs, etc forming building and complexes. Shapes are used to differentiate between device types such as hexagons for mobile devices and round towers for databases. Traffic between the nodes is represented through coloured lines. Erratic behaviour such as failed nodes or overloaded nodes can be spotted by looking at traffic flow lines. Using a VR headset, the analyst can move about the city and monitor the health and activity of his system in real time. The problem area can be focused upon by bringing up contextual information for that particular component.
Concerns and Suggestions
| Concerns | Description | Suggestions |
| Occlusion | Small “buildings” hidden behind big buildings | Fly-over design Use of variety of colours Adequately bright environment Audio signals in addition to visual ones |
| General Overview | Only current information not enough for detailed analysis | Traditional dashboards incorporated as 3D cubes available on request (e.g. through a menu summoned up through special gestures) Past and predicted information for points of concern on double tapping Annotations or flags option |
| Context Switching | The overhead of switching between immersive and non-immersive applications | Connections to periphery devices and systems built within the immersive environment, e.g. commands to print out a report from within the immersive system. |
| Navigation issues | How to navigate through huge amounts of data and data sources | Fly-over design Tele-porting or jumping from one point to another |
| Security | User-discretion: not all users have the same security clearance | Securing communication channels Means to selectively display information, e.g. user-based privileges Auto-sign-out when HMD taken off |
2. Telecom Business Intelligence
In immersive Business Intelligence areas (like CAVEs, large tiled displays or HMD-supported visuals), visuals such as live telecom activity, or the company’s operational metrics (such as revenue at different times, calls volume, data usage, etc), laid out over maps of the operational regions (or network “cells”) can be projected. The granularity of information can be chosen by focusing in or out through control parameters or a summon-able menu. Operational statistics such as revenue generated in different time slots, regions, or demographics, can be visualized, areas with improvement margin can be highlighted, and special price plans and packages can be designed considering the insight gained, with annotations and note-taking within the environment. Performance thresholds for different teams and different regions can be set by scenario planning in the VR, putting in realistic, optimistic and pessimistic performance parameters as input and their expected outcomes automated in the VR.
Geographically-distributed teams can connect to the environment as avatars, or the environments can be made available on a cloud service.
Concerns and Suggestions
| Concerns | Description | Suggestions |
| Occlusion and information overload | Too much data, especially in live feed. | Walk-through and fly-over designs Controlled information granularity Use of variety of colours Adequately bright environment Information layers to be added or removed as required |
| Geographically distributed teams | Not all operational locations can be afforded immersive environments | Remote connection to central immersive environments as avatars Making environments available on cloud platforms |
| Context Switching | The overhead of switching between immersive and non-immersive applications | Connections to periphery devices and systems built within the immersive environment, e.g. mechanisms to pull information from ERP. Annotations and minutes within the environment, and upload to storage |
| Navigation issues | How to navigate through huge amounts of data and data sources | Fly-over design Tele-porting or jumping from one point to another The ability to juxtapose documents, minimize or hide them Simple slide bars or drop-down menus for information drilling; or gestures to add data (e.g. drag a certain region to include it to an active dashboard) |
| Security | User-discretion: not all users have the same security clearance | Securing communication channels Means to selectively display information, e.g. user-based privileges Auto-sign-out when HMD taken off |
3. Financial Data
Since the sources of data can be many and varied, a user can surround himself with data and refer it to with merely moving his head. The data can include contextual information such as a market’s and a company’s historic performance and tenacity, the company’s internal factors (Management decisions, employee strikes, products’ success or failure) as well as external factors (political situation, security situation, trade policies, forex inflow or outflow etc), and future predictions. Colour coding can be used to indicate point of interests such as thresholds. Non-financial sources such as news can be augmented as financial markets are directly affected by security and political situations globally and locally. Data can be filtered with simple common mechanism such as drop downs or sliders; and information can be layered upon each other with intuitive gestures. Help features. On a higher level, performance of different stocks ca be measured against each other in a 3D cube with information coded as colours, shapes, sizes, and analysis can be done on a time-scale.
Concerns and Suggestions
| Concerns | Description | Suggestions |
| Information overload | Too much heterogeneous data. | Juxtaposing information in different dimensions or varying levels of depth, e.g. current stock prices on one wall and historic ones on another, current market activity in the foreground and live news deeper in the field of view Controlled information granularity |
| Context Switching | The overhead of switching between immersive and non-immersive applications | Connections to periphery devices and systems built within the immersive environment, e.g. getting live news. doing internet search, or picking stocks from within the environment. Annotations within the environment Colour coding for performance thresholds Trading by picking or discarding stocks as physical objects |
| Navigation issues | How to navigate through huge amounts of data and data sources | Use of dimensions and depth to include layers of information The ability to juxtapose documents, minimize or hide them Simple slide bars or drop-down menus for information drilling; or gestures to add data (e.g. drag a certain stock to include it to an active dashboard) |
| Security | User-discretion: not all users have the same security clearance | Securing communication channels Means to selectively display information, e.g. user-based privileges Auto-sign-out when HMD taken off |
4. Seismic/Geological Data
Geological terrain can be walked-through in a 3D rendering in an immersive environment with information such as gas pressure, oil production, temperature, etc available on demand. Areas and parameters can be dropped on and off the visualizations. Dashboards can be projected in fields of view and daily and historic data and trends can be presented in 3D cubes. Cross-functional teams can collaborate live and present their findings and ideas together while working on, say, a drilling plan. Algorithms can be fed to the system to create most feasible paths and displays them in a 3D space. Special concerns about a location can be annotated onto the visualization.
| Concerns | Description | Suggestions |
| Information overload | On-site sensors produce a continuous stream of data | Only collated information and statistics shown Past and predicted information for points of concern on double tapping Annotations or flags option |
| Context Switching | The overhead of switching between immersive and non-immersive applications | Connections to periphery devices and systems built within the immersive environment, e.g. ability to fetch information from ERP. |
| Security | User-discretion: not all users have the same security clearance | Securing communication channels Means to selectively display information, e.g. user-based privileges Auto-sign-out when HMD taken off |
| Cross-team collaboration | Different user groups such as engineers, geophysicists, business analysts, management | Centralized design (no daily updated spreadsheets) Dashboard to view historic information and trends Ability to work simultaneously with different teams when needed Virtualization of operations such as drilling before commencing them |
Future Work
- Inclusion of more senses in immersive environments, e.g use of haptics and sound
- Making HMDs more wearable and non-inhibiting
- Making CAVEs available remotely
- Homogenizing data from different sources
- Social issues such as workplace acceptance, and privacy and ethical issues
- Finding ways to de-clutter information in a wide field-of-view