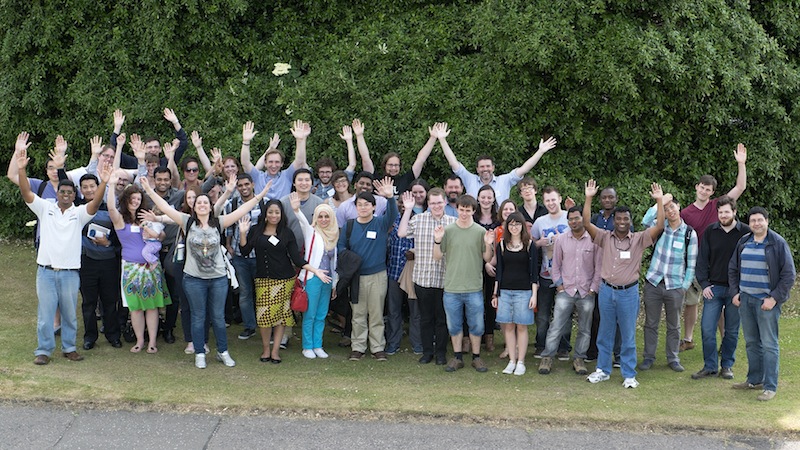
Big Data Information Visualisation
SACHI the St Andrews Computer Human Interaction research group and the Big Data Lab St Andrews together ran a SICSA supported “Big Data Information Visualisation” summer school in 2013. This summer school was concerned with the processing, management and hence presentation of “big data”, in an intelligible form with information visualisation techniques and methods. Data-intensive researchers talk about the “three Vs” of Big Data: Volume, Velocity and Variety (see CACM post). In this summer school we tried to demystify the concept of big data by introducing a systematic, scientific and rigorous approach to tackling it. We took a blended theory and practice approach, by providing both theoretical underpinnings and practical use of the infrastructure to process big-data and the means to understand it with information visualisation.
Final Projects:
Congratulations to Team Elm who took first place in the final project presentations and to teams Cedar and Ash who received honourable mentions for their work!
Schedule:
| Sunday July 7th | |
| 19.30 | Informal welcome drinks (all registered students and guest lecturers welcome) – Westport St Andrews |
| Monday July 8th | |
| 9 – 10 | Registration with Tea/Coffee Location: Jack Cole Building, University of St Andrews |
| 10 – 10.10 | Introductions and Welcome |
| 10.10 – 10.30 | Professor Aaron Quigley and Dr Adam Barker (St Andrews) Overview of the Summer School Summer School on Big Data Information Visulisation
|
| 10.30 – 11.30 | Professor Peter Triantafillou (University of Glasgow) Big Data: Why, What, and How? |
| 11.30 – 12 | Coffee Break |
| 12 – 1 | Professor John Stasko (Georgia Tech, USA) The Value of Visualization for Exploring and Understanding Data |
| 1 – 2 | Lunch (provided on day 1) |
| 2 – 3 | Sean Owen (Myrrix and co-author of Mahout in Action) Mahout, distributed and scalable machine learning algorithms on the Hadoop platform |
| 3 – 4 | Professor Sheelagh Carpendale (University of Calgary, Canada) Information Visualization: Exploring New Options |
| 4 – 4.50 | Lectures by Domain Experts providing Data Overviews in Parallel Sessions |
| a) | Dr Uta Hinrichs (St Andrews) Historical Data Records |
| b) | Dr. Urska Demsar (Centre for GeoInformatics St Andrews) Migration and Commuting Flows |
| c) | Dr. Alex Voss (St Andrews) Social Media |
| d) | Toby Atkin-Wright (brightsolid) Newspaper Data |
| 4.50 – 5 | Professor Sheelagh Carpendale (University of Calgary, Canada) Overview of InfoVis sketching session on Tuesday |
| 5.00 – 5.30 | Fast foot session (students overview their projects) |
| 6.45 – 7.45 | Rónan McAteer (Watson Solutions Development IBM Software Group Ireland) Cognitive Computing: Watson’s path from Jeopardy to real-world Big (and dirty) Data |
| 8pm | Welcome Dinner Reception in Zizzi’s in South Street for all registered students and guest lecturers |
| Tuesday 9th | |
| 9 – 10 | Dr Adam Barker (University of St Andrews) Cloud Computing and Big Data |
| 10.00 – 11.00 | Dr Stratis Viglas (University of Edinburgh) Big Data Programming Models |
| 11.00 – 1.30 | Hands on Exercises with Big Data – Richard Mccreadie (Glasgow) (coffee in the lab) |
| 1.30 – 2.30 | Lunch (not provided) |
| 2.30 – 3.50 | Professor Sheelagh Carpendale (University of Calgary, Canada) Information Visualisation Sketching Session |
| 3.50 – 4.50 | Professor Aaron Quigley Information Visualisation Toolkits |
| 4.50 – 5.30 | Fast foot session (students overview their projects) |
| 19.30 – evening | Group Project Work |
| Wednesday 10th | |
| 9 – 10 | Iadh Ounis (University of Glasgow) Information Retrieval and Real-time Analysis with Storm |
| 10 – 11 | Drs Miguel Nacenta and Uta Hinrichs (University of St Andrews) Information Visualisation and Interaction |
| 11 – 13.30 | Morning Working Session (tea/coffee in the lab) |
| 13.30 – 15.00 | Lunch and research poster session (delivered by students) |
| 15.00 – 17.00 | Afternoon Working Session (tea/coffee in the lab) |
| 17.00 – 17.30 | Fast Foot Session |
| 18.00 – 19.30 | Dinner at David Russell |
| 19.30 – evening | Group Project Work |
| Thursday 11th | |
| 9 – 10 | Professor Aaron Quigley Network Visualisation and Next Generation Information Visualisation methods |
| 10 – 11 | Dr Per Ola Kristensson Big Data and Crowdsourcing |
| 11 – 13.30 | Morning Working Session (tea/coffee in the lab) |
| 13.30 – 14.30 | Lunch (not provided) |
| 14.30 – 17.00 | Afternoon Working Session |
| 17.00 – 17.30 | Fast Foot Session JC 1.33a/b |
| 17.30 – 19.30 | Evening Working Session in the lab |
| 19.30 – 22.00 | Farewell dinner in Swilcan Restaurant at the Links Club house |
| Friday 12th | |
| 9 – 13.30 | Morning Working Session (tea/coffee in the lab) |
| 13.30 – 14.30 | Lunch Provided |
| 14.30 – 16.30 | Final Project Presentations Judges Toby Atkin-Wright, brightsolid, Dundee John Stasko, Georgia Tech Sheelagh Carpendale, Calgary Jessie Kennedy, Napier |
| 16.30 – 17.00 | Prize Presentations |
| 18.00 – 19.30 | Dinner at David Russell (for those staying) |
| 20.00 | Informal drinks in St Andrews |
Summer School Details:
A byproduct of the explosive growth in the use of computing technology is that organisations are generating, gathering, and storing data at a rate that is growing every year. The ability for a mid-sized organisation to store and expect to usefully employ 100s of terabytes of data is within reach. Larger organisations or organisations with special purpose scientific equipment or processes are often collecting and processing petabytes of data. In addition to the growth of data size (volume), organisations are also depending on data of an increasing variety which they are gathering at an increasing velocity. “Data that exceeds the processing capacity of conventional database systems. The data is too big, moves too fast or doesn’t fit the structures of your architecture” [Dumbill] can be considered “Big Data”.
Domains that deal with big data include many of the sciences along with geographic information systems, geophysical data systems, medical systems, financial analysis, software development, social media or online systems. The amount of data makes the analysis task difficult. One approach to this problem is to convert data into pictures and models that can be graphically displayed. The intuition behind the use of such graphics is that human beings are inherently skilled at understanding data in visual forms. Information visualisation is concerned with the presentation of abstract data, in a visual form. Visually, humans can perceive more patterns linking local features in the data. So the essential idea in information visualisation is that the user’s perceptual abilities are employed to understand and explore such information.
It’s widely identified that the rate at which we can collect and store data is rapidly outstripping the provision of tools for the effective analysis and exploration of it. This summer school introduces Information Visualisation for “big data” as a means to display, explore, query, process, understand, represent and even repurpose the voluminous amount of raw data, meta-data and user data often collected.
The intended audience for this school were graduate students across SICSA, the UK and Europe who are either focussed on research in this area or are seeking to use big data methods and information visualisation to make sense of voluminous data. In this summer school we drew on our experience with a previous SICSA summer school, an international Information Visualisation summer school and research on cloud computing, big data, data mining and visual analytics. We took a blended theory and application approach here with hands on work with big data systems and information visualisation toolkits. We will be making use of our local cloud computing infrastructure, and multi-TB datasets with 50billion flows etc. We introduced the basics here with realistic scale data (xTB, 50B connections), tools (eg. D3) and systems (eg. Eucalyptus). We provided access to 100’GB to TB scale datasets along with AWS access for processing and presenting the data.
Lecturers and Data Domain Experts Involved:
- Adam Barker, School of Computer Science, University of St Andrews
- Sheelagh Carpendale , University of Calgary, Canada
- Urska Demsar, Centre for GeoInformatics, University of St Andrews
- Uta Hinrichs, School of Computer Science, University of St Andrews
- Craig Macdonald, Department of Computing Science, University of Glasgow
- Richard Mccreadie, Department of Computing Science, University of Glasgow
- Rónan McAteer, Watson Solutions Development IBM Software Group Ireland
- Miguel Nacenta, School of Computer Science, University of St Andrews
- Iadh Ounis, Department of Computing Science, University of Glasgow
- Sean Owen, Myrrix and co-author of Mahout in Action, UK
- Aaron Quigley, School of Computer Science, University of St Andrews
- John Stasko, Georgia Tech, USA
- Peter Triantafillou, University of Glasgow
- Stratis Viglas, University of Edinburgh
- Alex Voss, School of Computer Science, University of St Andrews
- Toby Atkin-Wright, brightsolid, Dundee
Historical details on the school:
Registration fee:
£250 (no accommodation) or £440 for 4 nights accommodation, £500 for 5 nights or £560 for 6 nights (no other options are available and only Mon-Fri is guaranteed, other options Sunday/Friday nights only if available). Accommodation is on campus and is expected to be at the David Russell Apartments. The registration fee covers the workshop, the welcome reception on Monday, the farewell dinner on Thursday along with breakfast and dinner each day. Lunches are not included except for the final day (when the presentations occur). The summer school will coincide with the main tourist season here where hotel prices in town tend to be very inflated so if you are staying we encourage you to take advantage of the accommodation available.
Travel:
Students are responsible for their own travel arrangements and expenses to get to St Andrews. SICSA students can access local support from their own schools and departments to support such travel.
SICSA:
SICSA will cover the £500 registration fee for PhD students from most Scottish Universities (see the SICSA web-page for a list of departments that are part of SICSA). The number of SICSA students is limited to 15 and a decision on ranking if this number is exceeded will only be taken if necessary.
Application Deadline:
March 15th, 2013 (now closed)
Directions:
The accommodation for participants attending this summer school will be in the David Russell Apartments at the University of St Andrews. The venue for the summer school seminars and group work sessions will be in the School of Computer Science (Jack Cole and John Honey buildings) in the University of St Andrews. The University of St Andrews is in Fife Scotland and is approximately 30 minutes south east of Dundee and 90 minutes north east of Edinburgh. The two closest airports are Dundee and Edinburgh.


